Amazon DSP, branded search and revenue: a US bedding brand
Over 12 months, a US bedding brand's branded searches and revenue rose and fell with its Amazon DSP spend (correlation r ≈ 0.82). Each extra $1 of DSP spend went with about 0.067 more branded searches and about $10.73 more revenue.
The brand and the question
A US bedding brand selling on Amazon, in a crowded category, wanted to know whether its Amazon DSP budget was building awareness that showed up in sales. We used the account's own data from March 2023 to February 2024 and measured two things:
- Branded searches on Amazon, as the measure of awareness: a shopper who types the brand's name already knows it.
- Revenue: total sales in US dollars.
The brand is not named here. We never publish a client's name, logo or products.
How we measured it
We fitted two simple linear regressions on the account's data for the period: DSP spend against branded searches, and DSP spend against revenue. A regression draws the straight line that best fits the points and shows how much one number tends to move when the other does.
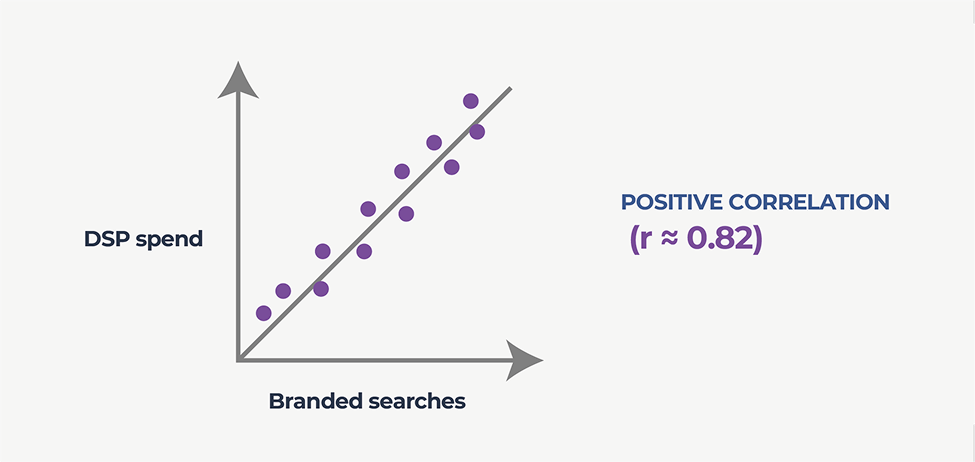
DSP spend against branded searches: a positive correlation, r ≈ 0.82.
What we found: awareness
Branded searches moved closely with DSP spend: the correlation was strong, r ≈ 0.82. The fitted model puts each extra $1 of DSP spend at about 0.067 more branded searches, and predicts around 1,283 branded searches at $15,000 of spend.
What we found: revenue
Revenue moved with DSP spend too. The second model puts each extra $1 of DSP spend at about $10.73 more revenue, and predicts about $158,513 in revenue at $15,000 of spend.
How to read these numbers
A regression shows how closely two numbers moved together over a period. It does not prove that DSP alone caused the change: seasonality, sponsored ads, price changes and promotions can move spend, searches and sales at the same time. So we treat a result like this as a strong signal, then measure what DSP adds on its own with a holdout before scaling a budget on it.
To run that test on your own account, start with holdout testing on Amazon DSP and how to tell whether display is incremental.
What it meant for the brand
For this brand, DSP spend and branded demand moved together closely across the year, and revenue followed. Branded search was a useful early read on whether the upper-funnel spend was working.
Want the same measured on your account? We run Amazon DSP as a managed service and show the method before the number.
Book a DSP discovery callMore results
- Five more Amazon DSP resultsOrganic lift, new-to-brand growth, a Prime Week test, link-out campaigns · all anonymized
- All case studiesCase studies