


Amazon just made your spreadsheets feel prehistoric.
In November 2025, Amazon rolled out a new Reporting API in SP-API. You get fresher signal, richer metrics, and AI nudges that push action. In plain words, build a live retail cockpit with minutes, not days, of lag. Finally connect sales, traffic, and finance in one place that actually syncs. Move from “what happened last week?” to “what’s happening now, and what do next?”
If you juggle CSVs, Vendor Central exports, and six Looker dashboards, breathe. This is the unlock you waited for. Get programmable access to sales and traffic with tighter financial rollups. And recommendations you can actually use without waiting for the weekly ops sync. Fewer manual merges, fewer broken sheets, more signal, faster moves. Hours instead of days.
Prime Day 2024 was Amazon’s “biggest ever,” and the train isn’t slowing. In a market this wild, lag kills. Winners spot the signal early and act even earlier. The gap between a good week and a great month is one quick call. Fix a leaky ad, defend the Buy Box, or run a price test now. Do it while you still have stock to ride the wave.
TLDR
- Real-time Reporting API in SP-API speeds up sales, traffic, and finance data.
- Build custom dashboards and trigger workflows from live metrics: pricing, ads, inventory.
- AI recommendations rank actions for you—no more hunting for the why.
- Borrow playbooks from GA4, YouTube, and Salesforce analytics APIs.
- Start with one high-leverage KPI loop; expand after you prove ROI.
What the Reporting API unlocks
Real time retail signal
The SP-API Reporting upgrade moves you past stale, batchy pulls. Now you can query what’s happening right now, with less friction. That matters when a promo hits, you win the Buy Box, or a rival undercuts price. On big days like Prime Day or holidays, minutes swing thousands of dollars. Faster reads mean fewer missed windows and tighter experiments.
First-hand example: You run a 10% coupon on a hero SKU. Within an hour, traffic spikes but conversion drops 4 points. A quick pull shows CPCs jumped and a competitor launched a bundle. You pivot fast—raise bids on the converting term, cap the leaky one. Add an image tile calling out the coupon for clarity. Conversion rebounds same day, not next week.
One more twist: inventory coverage on that SKU falls to 9 days. In near-real time, you trim broad spend by 15% and keep exact hot. You nudge price up 1% to slow the burn without tanking demand. You protect contribution margin while inbound clears. That’s riding demand instead of stockouts wrecking the flywheel.
From data to decisions
It isn’t just more data; it’s actions you can take. Think rules like: traffic up + conversions down + CPC up? Change bids and refresh creative. Served as an AI nudge you accept, ignore, or automate. You set thresholds and costs; the system bubbles up top ROI moves. It’s triage for chaos—show the 5 actions that pay, not 50 charts.
Mental model: Reporting API is sensors; AI is triage. You’re still the pilot. You choose when to change price, pause a keyword, or pull a listing for fixes. Guardrails matter—cap daily budget deltas and require review for high-impact changes. Log every accepted nudge for post-mortems later.
Proof point: Amazon called 2024 Prime Day its biggest ever. Volatility is normal now, not rare. Your edge is speed in linking traffic, price, and supply to a real decision. Winners bake this loop into operations, not just dashboards.
Build your retail cockpit
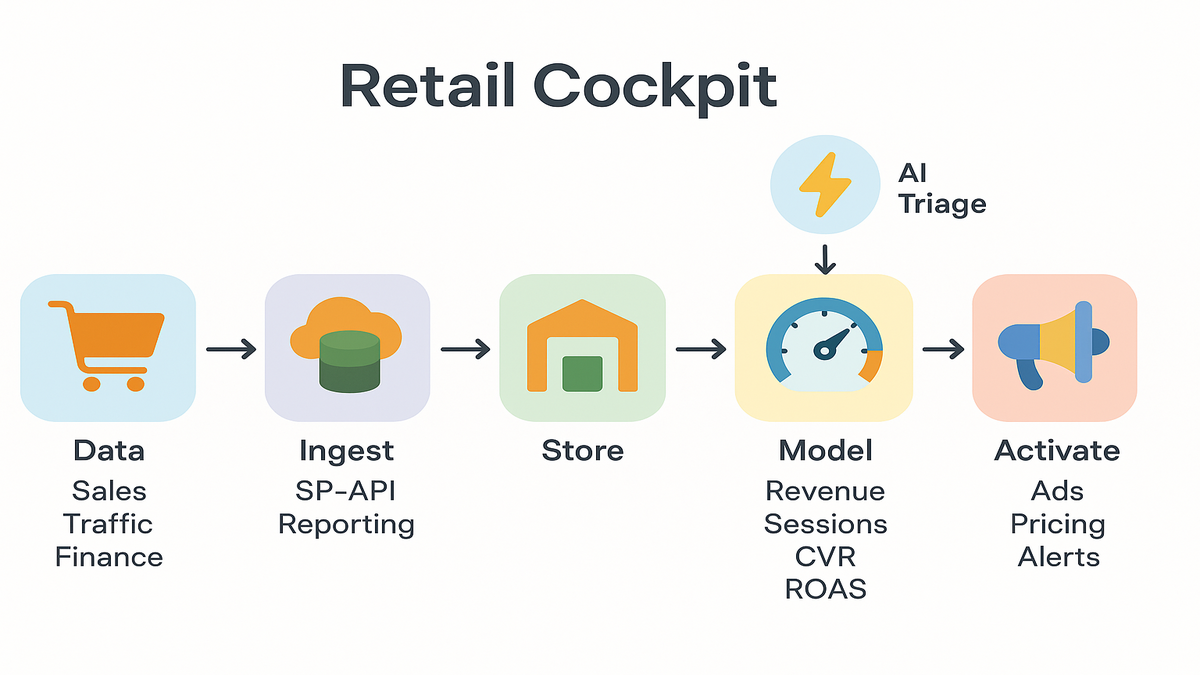
Data flow at a glance
Simple stack:
- Ingest: Call SP-API Reporting endpoints on a steady cadence with cron or a queue. Use short windows for near-real-time deltas and longer for financials.
- Store: Land raw in object storage, model in a warehouse like Snowflake, BigQuery, or Redshift. Keep immutable raw plus a curated layer.
- Model: Materialize KPI views—sales velocity, glance views, ROAS, ship-ready units, and contribution margin.
- Activate: Pipe signals to apps—ad bidding, pricing engines, or alerts in Slack or Teams.
Need to turn signals into programmatic lift? DSP Services ties retail intent to Amazon DSP audiences and bidding. Your media reacts in real time.
First-hand example: A 15-SKU supplements brand builds a “Daily Revenue at Risk” tile. It’s sales velocity x days of cover x price, simple and loud. If days of cover < 7 and velocity > trailing median, trigger a PO. Also throttle ads 10% to stretch stock until inbound lands.
Add a little structure:
- Dimensions to standardize: date, marketplace, ASIN, SKU, parent ASIN, brand, fulfillment type, promo flag, ad campaign/ad group/keyword, device type.
- Metrics to materialize: sessions (glance views), unit session percentage (conversion), ordered units, ordered revenue, net revenue after fees, ad spend, CPC, ROAS, return rate, contribution margin dollars, on-hand units, days of cover.
- Business rules to encode: one source of truth for price, currency normalization by marketplace, mapping between ASIN and SKU, and Buy Box status.
Pick your API analytics tools
If you’ve used the GA4 Data API, the muscle memory carries over. Define dimensions, metrics, filters, and date ranges, same rhythm. YouTube Analytics API and the older YouTube Reporting API organize around channel and video. That’s a handy pattern for brand → ASIN → SKU hierarchies.
Also note analytics api salesforce, the Analytics REST API. It handles big paginated results and long-running jobs with polling. Those patterns help with retail reports at scale.
Tools to consider:
- Warehouses: BigQuery, Snowflake, Redshift for low-latency joins.
- Orchestration: Airflow, Dagster, or serverless schedulers for steady runs.
- BI: Looker, Power BI, Mode—plus metric layers with dbt for governance.
- Alerting/activation: webhooks, Lambdas, or a thin Flask or FastAPI app.
Pro tip: Design jobs to be idempotent—re-runs shouldn’t double-count anything. Partition by date + ASIN and upsert with stable keys.
Helpful patterns to borrow:
- Incremental loads: query the last N hours plus a small overlap window. Catch late arrivals, then dedupe cleanly.
- Job fencing: only one ingest job per marketplace or brand runs at once. Others queue patiently.
- Metadata tables: track query start and end, rows returned, checksum totals, and source version.
Scale across marketplaces and brands
As you scale, two pain points hit fast: currency and time zones. Normalize into a base currency at reporting time, store originals too. Align timestamps to UTC in storage; convert to local time in BI later. Keep a marketplace dimension table with locale, currency, Prime flags, and tax quirks.
If you manage multiple brands or seller accounts, enforce global IDs. Create a stable brand_id, map ASINs to brand and category, and name campaigns consistently. Then roll up “margin by category across 7 marketplaces” without bespoke logic.
Retail metrics that move PL
Sales and traffic heartbeat
Your base loop ties sales, sessions, conversion rate, and price. That’s the daily pulse. Layer ad data—spend, clicks, CPC, ROAS—to find waste and winners. Link price elasticity to traffic; some categories are touchy, others shrug. Watch Buy Box share if you aren’t the only seller. Lose it and conversion tanks even with steady traffic.
First-hand example: Conversion dips after a 5% price hike. Traffic holds, CPC stable. Elasticity looks high, so you roll back price and test a bundle. You keep original margin with add-ons. A week later, total margin dollars beats baseline even with lower ASP.
Another scenario: traffic climbs 18% on a seasonal keyword, yet units stay flat. Your “What changed?” tile shows the main image updated two days ago and bullets shortened. You revert copy and test a comparison chart in A+ content. Push exact-match ads on that seasonal term to reinforce. Conversion recovers within 48 hours.
Cash returns messy middle
Revenue is vanity; contribution margin is sanity; cash is reality. Stitch fees, returns, and shipping in your models. Flag SKUs where return rate x cost-to-serve nukes margin hard. Link inventory aging to price and ads. No point buying clicks if inbound is weeks out or stock is stale. Add a simple “cost per return” line. Everyone sees the penalty from heavy discounts without quality controls.
Causality watch-out: Don’t over-credit ads for swings driven by stock or listing edits. Add annotation tables—launch dates, image swaps, seasonality notes—to explain spikes without stories.
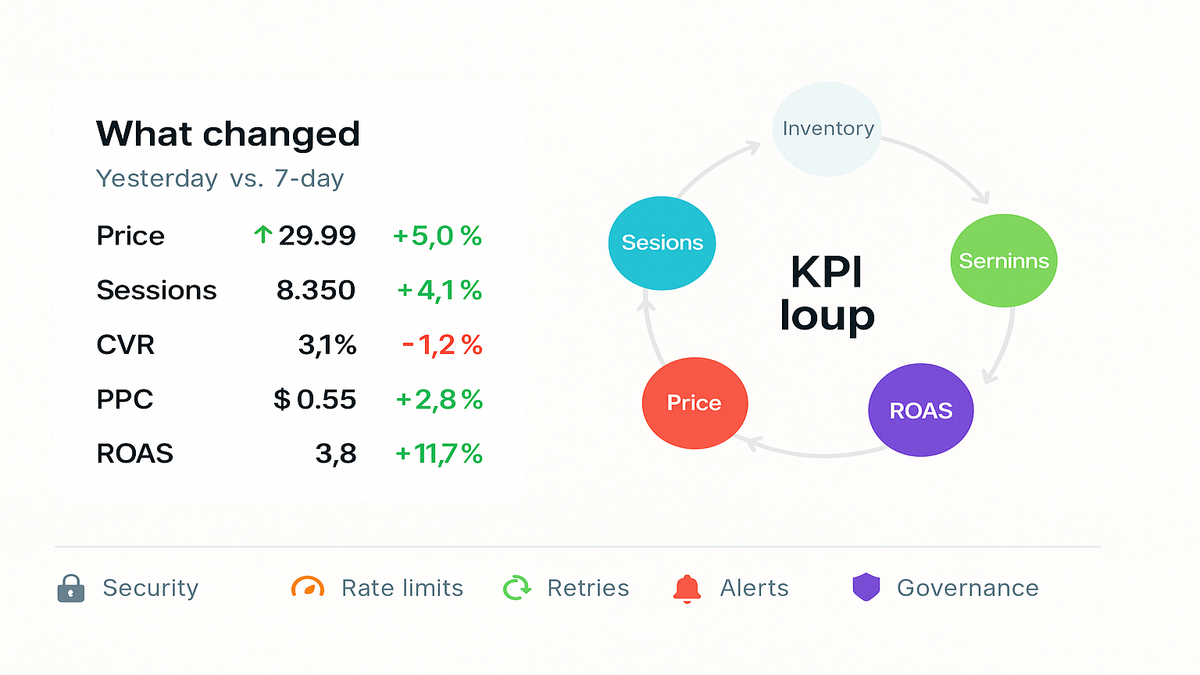
Pro tip: Build a “What changed?” view. Side-by-side yesterday vs. trailing 7-day for price, promo, stock, sessions, conversion, and ad spend. Make it the first tab you open each morning.
Forecasting and planning loops
You don’t need fancy models to get leverage.
- Moving averages: 7-day and 28-day for velocity, by SKU and marketplace.
- Exponential smoothing: reads trend fast without overreacting to one day.
- Simple reorder math: reorder point = lead time demand + safety stock. Tune safety by variability and supplier reliability.
- Promo overlays: label promo days so you don’t “learn” from warped weeks.
Use Reporting API data to refresh forecasts daily, like clockwork. Tie alerts to gaps, e.g., projected stockout date < 10 days. Goal is fewer fire drills and more planned pushes when you have stock.
Governance limits potholes to avoid
Rate limits and data integrity
APIs have opinions, and they will time out. Expect rate limits and random errors. Use exponential backoff, job queues, and dead-letter retries. Validate row counts against prior days and alert on weird deltas. If traffic = 0 across all SKUs, probably a failed job. Do small, frequent pulls for ops and bigger windows for finance reconciliation.
First-hand example: Your midnight job fails quietly and dashboards show zero revenue. A simple checksum—sum(revenue) > 0, else alert—saves two hours of panic. And fewer bad Slack threads, thankfully.
To automate freshness checks, anomaly alerts, and smart re-runs, try Requery.
Sampling and granularity: prefer atomic data when you can, aggregate in-warehouse. Avoid double-counting across overlapping windows—pick one metric source with versioned SQL. Use slowly changing dimensions for product attributes. That keeps history stable when titles change.
Observability basics:
- Freshness SLAs: set max lag by metric, like 60 min for ops, 24 hrs for P&L.
- Data tests: non-null key checks, valid ranges like conversion 0–100%, and uniqueness on composite keys.
- Drift detection: alert when a metric’s distribution slips outside historic bands.
Security compliance and keys
Treat SP-API credentials like prod secrets. Store in a vault, rotate often, and scope by role. Log all access, especially for write flows like pricing and ads. Map data flows so you know what leaves your VPC and why. Encrypt at rest and in transit. Keep audit logs for who approved AI-driven changes and when.
Benchmark with peers: GA4 and YouTube APIs are read-heavy and public-facing. Your Amazon retail data holds sensitive financials. Use the stricter standard. Salesforce’s permissioned analytics endpoints are a solid north star for least privilege.
Optional but smart: add a data contract. Define schemas, freshness SLAs, and table ownership. Future you will thank present you when a launch breaks a column name. Also, don’t mix PII with ops metrics unless you have a clear reason and controls.
Halfway checkpoint dont miss beats
- Build a tight KPI loop: sales, sessions, conversion, price, and ROAS.
- Automate the boring stuff: schedules, retries, and alerts with real thresholds.
- Use AI recommendations as triage, not gospel—you decide priorities.
- Borrow patterns from GA4, YouTube, and Salesforce APIs to scale clean.
- Guard keys, version metrics, and document your models.
FAQs your top questions answered
Is the new SPAPI realtime
It’s built for fresher, more frequent access than old file exports. “Real-time” varies by metric, so plan accordingly. Use near-real-time for ops signals and longer windows for finance. Build jobs around how fast decisions must happen, not just data speed.
How is this different
Legacy flows were batchy and slower to refresh. The new approach gives more granular access, faster availability, and AI-suggested actions. You should still keep batch reports for backfills and audits. Think streaming for daily moves, batch for month-end truth.
Do I need a warehouse
Not strictly, but you’ll want one once you grow. Past a few SKUs and marketplaces, a warehouse saves your brain. You’ll model consistent KPIs, avoid double-counting, and power fast dashboards and automations. Even a lightweight setup beats endless CSV merges.
How does this compare
Different domain, same playbook. YouTube Analytics and YouTube Reporting focus on video and channel performance. GA4’s Data API tracks web and app behavior. All reward clean schemas, clear metrics, and automated jobs. Declarative metrics and labeled dimensions save pain later.
Where do AI recommendations fit
Use them to rank actions—bid changes, price tests, and inventory throttles. Base on your rules and costs to stay sane. Keep human review for big swings like price or large budget changes. Log accepted and rejected tips and learn what truly drives ROI.
What about access quotas cost
Expect auth, role-scoped permissions, and rate limits everywhere. Design for retries and idempotency, always. Your real costs are compute, storage, and any third-party tools. Keep queries tight, cache smartly, and compress raw files to save storage.
Handle multiple currencies and taxes
Normalize sales and ad spend into a base currency for rollups. But store original currency for audits and clarity. Keep a daily FX table and stamp each conversion with the rate used. Centralize fee and tax logic in your curated layer for consistent P&L.
Ship your first Reporting dashboard
- Define the loop: pick 5 KPIs—revenue, sessions, CVR, CPC, margin. Write exact formulas and sources so math matches.
- Provision access: set SP-API creds and a secure secret store. Keep read-only where possible and rotate keys on schedule.
- Ingest: schedule a small, frequent job every 15–60 minutes for core metrics. Start with one marketplace and a few ASINs to reduce blast radius.
- Model: create a curated table with date, marketplace, and ASIN as stable dims. Add derived fields like daysofcover and ispromoday early.
- Visualize: build a “What changed?” dashboard with day vs. trailing 7. Put it on a big screen or set it as your start page.
- Alert: add thresholds like CVR down > 2 pts and spend up to ping Slack. Include links back to dashboards and the dataset for context.
- Iterate: run one weekly experiment—price, creative, or bid—then measure. Close the loop with a retro. Did it move the KPI you planned?
Here’s the punchline: the new Reporting API gives speed and clarity. You still need taste—what to push, what to ignore, and when to press. Start with one tight loop, sales ↔ traffic ↔ price ↔ ads, wired end-to-end. Let AI handle triage while you make the calls that drive P&L. The compounding hits fast once you cut latency and ambiguity.
One last promise to yourself: automate anything you do twice. Document anything someone asks about twice. Revisit alert thresholds monthly. That’s how you go from “we built a dashboard” to “we built an engine.”
