

If your app feels slow, but CloudWatch looks fine, you’re flying blind. The real bottleneck hides in how objects get requested, how often, and from where. And yes, those tiny GETs are stealing speed.
Here’s the good news. Amazon S3 Storage Lens just added eight new performance metric categories. They aggregate daily across your org, accounts, buckets, and prefixes. Translation: you finally get performance insights with examples you can actually act on.
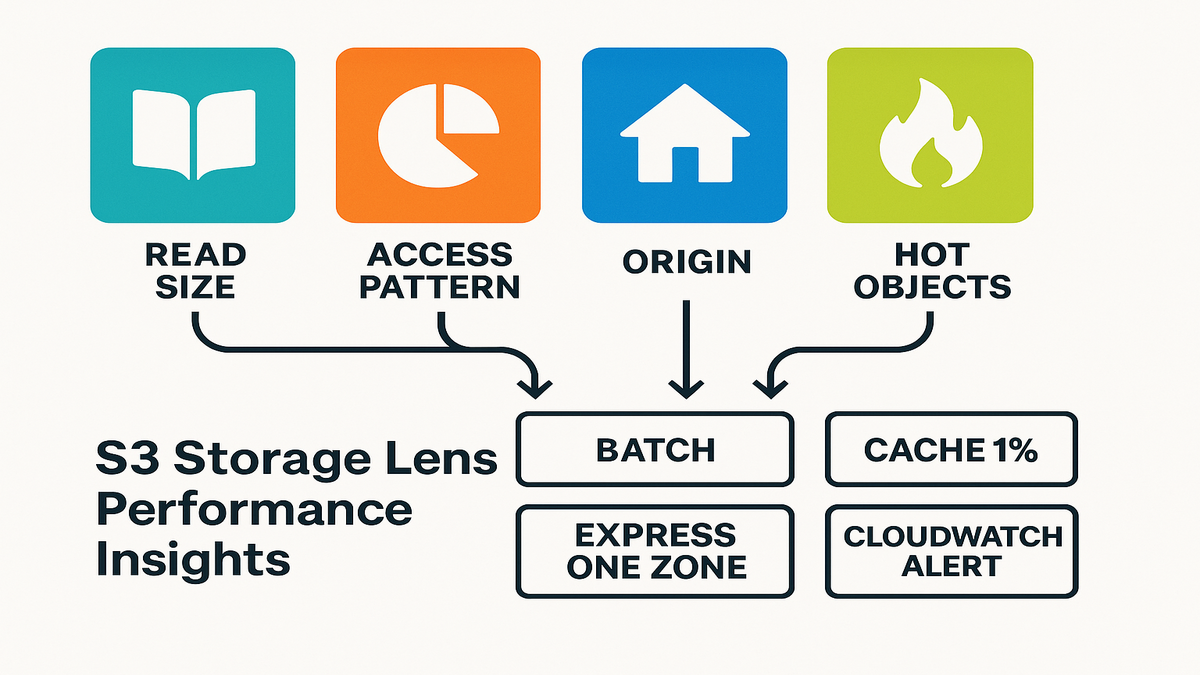
You’ll spot patterns like small, frequent requests, the small-request tax hitting hard. You’ll see cross-Region hops and hot objects that deserve faster storage. Then you’ll fix them. Batch small reads, cache the top 1%, or move latency-sensitive sets to S3 Express One Zone.
This isn’t just a nice dashboard. It’s a roadmap to faster load times, happier users, and lower network overhead.
TL;DR
- New S3 performance metrics expose inefficient access patterns and cross-Region hops.
- Read Request Size highlights small GETs; fix with batching or S3 Express One Zone.
- Request Origin reveals latency from cross-Region access. Cache or colocate data.
- Object Access Count finds hot objects worth caching or tiering up.
- Export daily metrics to CSV or Parquet, or publish to CloudWatch for alerts.
Your new S3 speedometer: eight signals you actually need
What changed
Amazon S3 Storage Lens now ships eight new performance metric categories. They appear across four scopes: organization, account, bucket, and prefix. You’ll see them in the S3 console dashboard. Metrics are aggregated and published daily. You can export reports in CSV or Parquet to any S3 bucket you own. Or publish them to Amazon CloudWatch for deeper analysis and alerting.
These aren’t vanity stats. Think metrics Amazon teams actually use. Read Request Size distributions, Access Pattern metrics, Request Origin counts, and Object Access Count. In plain English: how big your reads are, how often you hit S3, where traffic comes from, and which objects get hammered.
If you’ve used Storage Lens before, you know the vibe. Organization-wide visibility with drill-down by account, bucket, and prefix. The new performance categories slot right into that model. You can investigate a slow user flow, zoom from org → account → bucket → exact prefix, and see daily patterns behind your p95. No more chasing hunches across services.
One practical note. These performance metrics live in the advanced tier. Enable them per dashboard, pick your scopes, and choose exports. For larger environments, wire Parquet export on day one. You’ll want history for trend analysis and to prove your fixes moved the needle.
Why you care
This is where performance metrics in data analysis meets reality. You’re done guessing which prefixes are killing p95 latency. You can pinpoint a workload sending 10K tiny GETs per minute from another Region, then fix it fast. If you wanted performance metrics insights with examples you can apply, this is it.
“Batch small objects or leverage the Amazon S3 Express One Zone storage class for high-performance small object workloads.” — AWS guidance
Even better, these metrics map to clear owner actions. If you run platform, you can nudge app teams with evidence, not opinions. If you own an app, you’ll spot bad patterns you introduced by accident. Like a refactor that turned one 2 MB GET into 400 chatty reads. That’s an easy rollback or a quick batch job.
And yes, this helps with cost governance too. Cross-Region requests add latency and potentially higher transfer costs. Unnecessary request storms mean more operations to pay for. Performance and cost are a two-for-one when you remove wasted work.
Stop paying the small-request tax (and win back milliseconds)
Spotting fragmentation with Read Request Size
Small reads feel cheap, until they multiply. The Read Request Size metric shows daily GET size distributions. If your workload leans into tiny ranges or small objects, you pay overhead. Network chatter, TLS handshakes, and client churn stack up. That’s the small-request tax.
This metric highlights datasets or prefixes where object layout fights your access pattern. If you see spikes in the smallest buckets, that’s your smoking gun.
What does small look like in practice? Thumbnail images pulled one-by-one. JSON blobs fetched piecemeal. A streaming reader grabbing a few kilobytes at a time. If SDK retries, pagination, or concurrency are off, you multiply tiny reads. Latency can spike during peak traffic.
Use Read Request Size over a few days to spot trends. Separate one-off spikes from structural issues. A batch job or migration looks different than a service pattern. If the smallest bucket dominates across days and prefixes, fix the layout, not just code.
Fixing it fast: batching and better placement
Two proven fixes:
- Batch or bundle: Combine related small objects into larger blobs or manifests. Fewer, larger GETs cut overhead and improve throughput. If you can’t repackage, use range GETs against a structured container format.
- Upgrade the hot path: For latency-sensitive small-object workloads, move them to S3 Express One Zone. It’s built for consistent, single-digit millisecond access at high request rates. AWS literally recommends it for this scenario.
Add a canary. Publish Read Request Size to CloudWatch and alarm when tiny buckets jump. That turns hidden performance drift into a visible page.
Make the change surgical, not scary. Start with a narrow prefix and a rollout plan. For bundling, create a manifest mapping object IDs to byte ranges. Then your app can read only what it needs via range GET. For placement, promote just the hot path to S3 Express One Zone. Keep the rest in your current storage class. Validate by comparing Read Request Size before versus after. If you use a CDN, watch cache hit ratios climb.
Extra credit: check client settings. Right-size connection pools, tune timeouts, and avoid retry storms. Even with better layout, a chatty client can erase gains.
Latency lives in geography: make Request Origin your friend
See the path your data actually takes
Request Origin metrics show when requests cross Regions. That’s a double hit. Higher latency and potentially higher transfer costs. If your app in us-east-1 keeps calling S3 in eu-west-1, you’re adding avoidable roundtrips.
You can slice this at org, account, bucket, and prefix. Find the exact namespace doing the cross-Region dance. Spoiler: it’s often a microservice nobody realized moved. Or a data science job with a hardcoded bucket.
This visibility shines during reorganizations, migrations, and multi-Region expansions. Teams shift compute to a new Region but reuse the old bucket “for now.” That temporary choice sticks. Request Origin exposes it. Add it to change management. When a service moves Regions, confirm the S3 access pattern moved too.
Reduce roundtrips, then optimize cost
Your playbook:
- Colocate data and compute: Keep hot datasets in the same Region as the app. If you run multi-Region, replicate the hotset.
- Add an edge: Front S3 with Amazon CloudFront for static content. Reduce latency and offload reads.
- Use Multi-Region Access Points for global workloads. Route to the closest Region.
- Monitor drift: If cross-Region counts spike in Request Origin, alert and investigate. That’s performance debt you don’t want.
This is one of those performance metrics examples that also saves money. Speed and cost control can share the same lever.
Reality check. Not every workload can be perfectly colocated. Compliance, residency, or legacy ties may force cross-Region access. In those cases, cache aggressively. Push large immutable assets closer to users. Document exceptions so they don’t bite later.
Pro move: pair Request Origin with deployment events. When a new Region goes live, measure cross-Region access. It should drop as expected. If it doesn’t, a routing rule, configuration, or DNS setting needs love.
Half-time huddle: what’s working (and what to fix next)
- Read Request Size reveals the small-request tax; batch or promote to S3 Express One Zone.
- Access Pattern metrics flag too-small or too-frequent requests.
- Request Origin shows when cross-Region access adds latency and cost.
- Object Access Count isolates your hot 1%—perfect for caching or higher-performance tiers.
- Export daily to S3 (CSV or Parquet) or publish to CloudWatch to automate alerts.
Use this checklist to prioritize. Start with quick wins. Stop cross-Region thrash, promote the tiny-object hot path, and batch the loudest offenders. Then build weekly reviews. If you ship fast, patterns drift fast. Storage Lens makes those drifts visible before they become incidents.
When a few objects carry the load, treat them like VIPs
Find the hot 1% with Object Access Count
Most workloads are Pareto. A small subset drives most traffic. Object Access Count surfaces prefixes and objects with outsized reads. That’s your VIP list. If your CDN or app cache isn’t tuned to that set, you’re leaving wins on the table.
Map the hotset across buckets and prefixes. If it’s small enough, move it to faster storage. If it’s large, cache it more aggressively and review TTLs.
Object Access Count also helps release hygiene. When you add new content or a model version, watch its rise. If a new hotset appears, pre-warm caches and ensure origin capacity. If an old hotset cools off, drop its TTLs or demote it to a cheaper class.
Upgrade strategy: cache, tier up, and simplify paths
Three upgrades that compound:
- Cache first: Push the hotset to CloudFront with the right cache keys and TTLs. For APIs, consider application caches like Redis or Memcached for repeated S3 reads.
- Tier up for performance: Put latency-critical hotsets on S3 Express One Zone. You’ll improve throughput and p95 latency consistency.
- De-duplicate access paths: If multiple services pull the same assets through different prefixes, consolidate. You’ll reduce requests and cache misses.
Pro tip: combine Object Access Count with Access Pattern metrics. If the same objects are hot and hit by tiny GETs, bundle them. Or store them in a layout optimized for ranged reads. That’s performance metrics insights, Amazon edition.
Two common gotchas to avoid:
- Mismatched cache keys: If your key includes noisy query params or headers, you’ll miss easy hits. Normalize them.
- Overlong TTLs: If content changes often, long TTLs cause stale responses and chaos. Keep TTLs sane and use ETags for validation where it fits.
From dashboards to action: exports, alarms, and queries that pay off
Get it out of the console
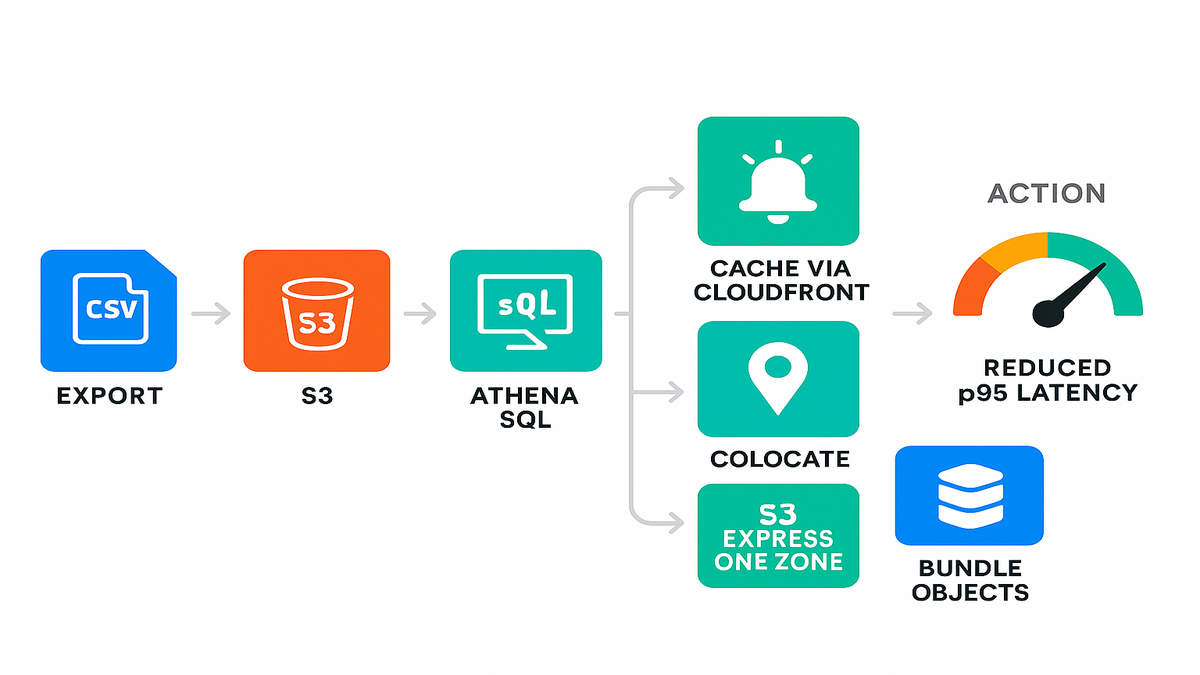
Pretty charts don’t page anyone. Storage Lens can export metrics to S3 in CSV or Parquet, daily, across your scopes. Parquet plus Amazon Athena gives instant SQL over performance history. That’s where real performance metrics in data analysis pipelines live.
Examples:
- Trend Read Request Size for a key prefix after a deployment.
- Correlate Request Origin spikes with a new Region launch.
- Identify buckets where Access Pattern metrics show request bursts.
Map the basic data flow:
- Export to a dedicated S3 bucket with lifecycle rules. Keep history without blowing up storage.
- Register the dataset in AWS Glue Data Catalog. Athena and QuickSight can discover it easily.
- Partition by date, and optionally by account or bucket. Keep queries fast and cheap.
- Create saved queries for common checks. Tiny-GET spike by prefix and cross-Region by service.
Once this hums, build a weekly report. Keep it light. The three worst prefixes by small reads, the top cross-Region offenders, and the new hot objects. Share wins so teams see the feedback loop working.
Wire alerts and build the feedback loop
Publish to Amazon CloudWatch and set alarms:
- Alarm when tiny-read distribution crosses a threshold for a given prefix.
- Alarm on cross-Region Request Origin counts for latency-sensitive services.
- Alarm when Object Access Count shifts and a new hotset emerges. Pre-warm caches or promote to faster storage.
Close the loop with a runbook. If alarm X fires, batch small objects, flip a routing rule, or move a hotset to S3 Express One Zone. That’s how insights become deployment-time automation.
Don’t forget permissions and guardrails. Limit who can change dashboards, exports, and alarms. Tag Storage Lens resources by environment and owner. Then you know who to ping when a metric goes sideways. Document thresholds—why they exist and how to tune them.
FAQs: quick answers while your export runs
1. How do I enable these new S3 performance metrics?
In the S3 console, create or edit a Storage Lens dashboard. Enable activity and performance metrics for your scope: org, account, bucket, or prefix. Choose export options, CSV or Parquet to S3. Optionally publish to CloudWatch for alerting. Metrics are aggregated and published daily.
2. What’s the difference between Storage Lens and S3 request metrics in CloudWatch?
S3 request metrics in CloudWatch are near real-time per-bucket or prefix counters. Think 4xx errors and total requests. Storage Lens aggregates broader usage and performance insights daily. It spans organization to prefix granularity. It adds Read Request Size, Request Origin, Access Pattern, and Object Access Count.
3. How do Request Origin metrics help with latency and cost?
They show cross-Region access patterns. If your app hits a bucket in another Region, latency rises. Transfer costs can rise too. With visibility, you can relocate data, add CloudFront caching, or use Multi-Region Access Points.
4. What should I do if Read Request Size shows lots of tiny GETs?
Batch objects, restructure into larger containers, or use range requests. For low-latency small-object workloads, consider S3 Express One Zone. Also check client behavior. Retry storms and chatty pagination hurt. Tune SDK timeouts and concurrency.
5. Is this the same as performance metrics for employees?
No. These are storage performance metrics for S3 workloads. If you want performance metrics for employees, that’s HR or people analytics. Totally different.
6. Can I analyze Storage Lens Parquet exports with SQL?
Yes. Register the exported Parquet dataset in AWS Glue Data Catalog. Query it with Amazon Athena. It’s a clean way to build recurring reports and QuickSight dashboards on trends.
7. Do these metrics provide historical data before I enable them?
Metrics populate after you enable a dashboard. They’re delivered daily. Plan ahead and turn them on before a big launch. Then you’ll have a clean before-and-after.
8. Will enabling advanced performance metrics cost extra?
Advanced metrics are a paid feature. Check AWS pricing and scope carefully. Many teams enable them on a focused set of accounts, buckets, and prefixes. You get signal without overspending.
Ship a faster S3 in one afternoon: the checklist
- Turn on Storage Lens performance metrics for your key buckets and prefixes.
- Export to Parquet in S3 and wire Athena for ad-hoc queries.
- Publish to CloudWatch. Create alarms for tiny-read spikes and cross-Region requests.
- Identify the top hotset via Object Access Count. Cache it or promote it.
- Batch small objects or switch the hot path to S3 Express One Zone.
- Re-run Read Request Size and Request Origin. Confirm the before and after delta.
You don’t need a six-month migration to make S3 feel faster. You need better signals and tighter loops. Storage Lens gives you both. Start with ugly truths. Tiny reads, cross-Region hops, and a handful of objects doing most of the work. Then turn those into wins. Batch more, cache smarter, and promote your hot path to faster storage when it counts.
If you build the habit—export, analyze, alert, fix—you’ll watch p95s drop. Incidents will shrink. That’s the compounding effect of performance metrics insights, applied at the prefix level, not just the whiteboard.
References
- Amazon S3 Storage Lens overview: https://docs.aws.amazon.com/AmazonS3/latest/userguide/storage_lens.html
- Storage Lens metrics glossary and dimensions: https://docs.aws.amazon.com/AmazonS3/latest/userguide/storagelensmetrics_glossary.html
- Publish Storage Lens metrics to CloudWatch: https://docs.aws.amazon.com/AmazonS3/latest/userguide/storagelenscloudwatch.html
- Amazon S3 Express One Zone: https://aws.amazon.com/s3/storage-classes/express-one-zone/
- Optimize performance for Amazon S3: https://docs.aws.amazon.com/AmazonS3/latest/userguide/optimizing-performance.html
- Amazon CloudFront for S3 content: https://aws.amazon.com/cloudfront/
- S3 Multi-Region Access Points: https://aws.amazon.com/s3/features/multi-region-access-points/
- Amazon S3 pricing for Storage Lens: https://aws.amazon.com/s3/pricing/#AmazonS3Storage_Lens
- Amazon Athena documentation: https://docs.aws.amazon.com/athena/latest/ug/what-is.html
- AWS Glue Data Catalog: https://docs.aws.amazon.com/glue/latest/dg/populate-data-catalog.html
- Amazon QuickSight overview: https://docs.aws.amazon.com/quicksight/latest/user/welcome.html
- S3 GET Object API (Range support): https://docs.aws.amazon.com/AmazonS3/latest/API/API_GetObject.html
- Amazon ElastiCache (Redis/Memcached): https://aws.amazon.com/elasticache/