

In December 2025, Amazon pulled the plug on deprecated FBA Subscribe and Save report types. If you depended on those reports for forecasting, discounts, or replenishment logic, this wasn’t a fix-it-later moment. It was a now-or-never migration.
Here’s the good news: you can protect ops, subscriber retention, and margins—if you move with a plan.
Most sellers only feel deprecations when things break. You don’t have to. With a smart cutover, you’ll reduce risk, kill data blind spots, and maybe speed up your reporting stack. The playbook below shows how to migrate SP-API calls, keep Subscribe & Save logic intact, and future-proof reporting. Bonus: you’ll borrow a few sharp governance moves from Salesforce report type management.
Think of this like a fire drill you actually want to run. You’ll pinpoint what data truly matters, plug gaps with supported SP-API surfaces, and simplify messy logic that grew around the old report types. Done right, dashboards get faster, forecasts more honest, and your team less panicked when Amazon flips a switch overnight.
And if you’ve been putting off data hygiene—naming, schemas, contracts—this is your clean slate moment. Rebuild the subscription view you always wanted: consistent fields, fewer one-off scripts, and clear ownership. Let’s turn a deprecation into an upgrade.
TLDR
- Deprecated FBA Subscribe and Save report types were removed on December 11, 2025—migrate or face data gaps.
- Inventory and churn risk spike if you lose S&S visibility (discounts, cadence, retention).
- Replace brittle report dependencies with modular SP-API calls and a schema-first data layer.
- Borrow Salesforce discipline: custom report types, field-level controls, and dual-run testing.
- Run a two-week migration sprint: inventory, map, dual-run, validate, cut over, monitor.
What actually changed and why
Removal event in plain English
On December 11, 2025, Amazon removed deprecated FBA Subscribe and Save report type values from SP-API. If your integrations queried those report types, they now return errors or empty responses. Any downstream jobs that relied on those outputs (like forecasting, discount eligibility checks, or subscriber cohort analysis) could fail or quietly degrade.
In practice, teams usually see one of three things: explicit API errors that show up in logs, zero-row files that look like success but contain nothing, or downstream tables that stop refreshing because a scheduler marked a task complete when no data arrived. If you haven’t set row-count or freshness monitors, the silent failure is the sneakiest—it doesn’t wake you up, but it starves everything fed by those tables.
Who impacted
- Sellers relying on Subscribe & Save metrics for replenishment planning.
- Teams that built logic around specific report type values (hardcoded IDs/filters).
- Developers who didn’t migrate during the deprecation window and now see job failures.
Also hit: BI teams with dashboards wired to those report outputs, finance partners who track subsidy costs against S&S revenue, and customer support who get slammed when skips or delays spike. If you’re an agency or integrator, expect multiple clients to feel it at once. Standardizing the fix will save your week.
Operational risks
- Forecast drift: You’ll under or over-order without cadence and skip or modify signals.
- Discount leakage: If you lose visibility into discount tiers, margins get weird fast.
- Subscriber churn: Delays or inconsistent deliveries push customers to cancel.
The spillover is real: PO timing slips, warehouse staffing runs hot or cold, and promo calendars drift out of sync. Once the flywheel wobbles, it takes weeks to reset. This is why your cutover plan should include both data and operations guardrails.
First-hand example (scenario): A mid-market household brand noticed their weekly forecast job started spiking no-data errors post-December 11. Their WMS was still placing vendor orders on stale assumptions. They rolled back to a manual CSV patch for a week—costing two analysts 20 hours and missing a replenishment window. Lesson: deprecations hit ops, not just dashboards.
The data you still need
Reconstructing Subscribe Save visibility
Even with the deprecated report types gone, your core needs haven’t changed:
- Subscriber counts and cadence by ASIN or SKU
- Discount tiers and eligibility rules
- Modifications (skips, frequency changes) and churn
- Fulfillment success rates tied to subscription orders
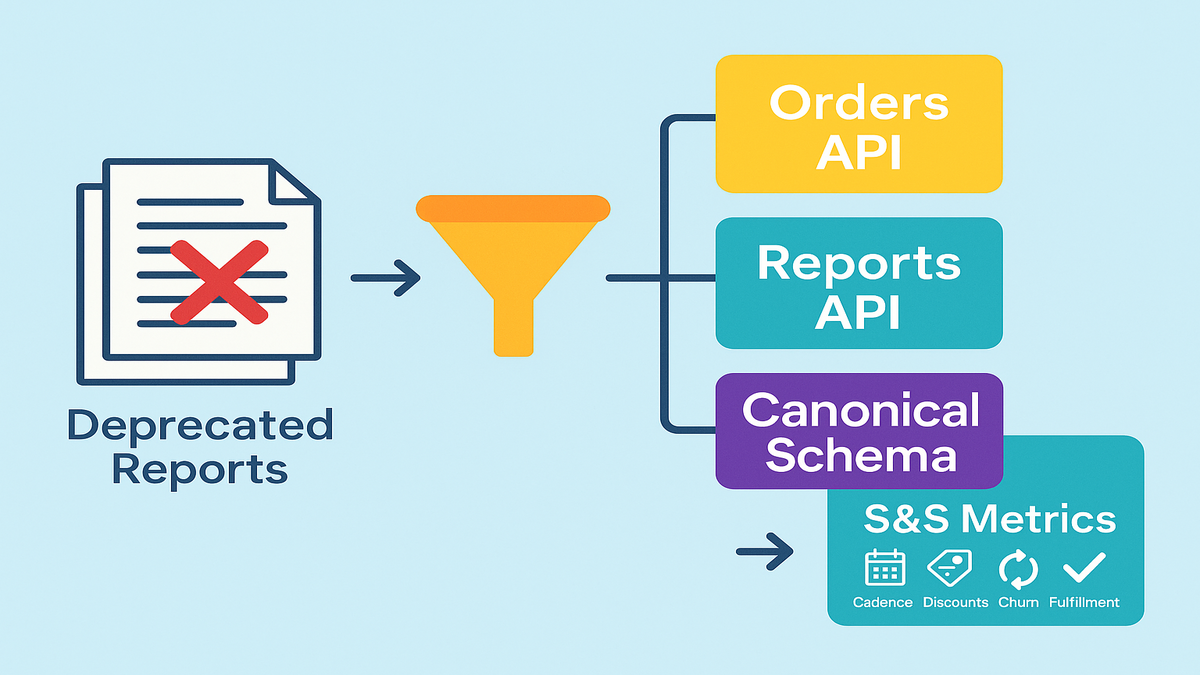
You can still assemble these datasets via SP-API’s current surfaces, your orders pipeline, and internal data warehouse modeling. The trick is mapping business logic—not chasing a one-to-one replacement report.
A simple canonical subscription dataset should include at minimum:
- subscriptionkey (synthetic), orderid, orderitemid
- asin, sellersku, marketplaceid
- issubscriberorder (boolean), subscription_frequency (days)
- nextexpectedshipdate, lastfulfilled_date
- discounttype, discountpercent, discount_amount
- quantity, unitprice, netrevenue
- status flags: active, paused, cancelled, skipped
- fulfillment_outcome (filled, backordered, partial)
- timestamps: createdat, updatedat, sourceingestedat
Define the grain up front. For most teams, order item per scheduled cycle is the sweet spot: one row represents one subscription occurrence per SKU, per cycle. That keeps cadence math, fill rate, and discount rollups consistent across sources.
What to monitor
- Fill rate for subscriber orders vs. non-subscriber orders
- SKU-level lead time volatility during subscription spikes
- Discount leakage: total subsidy vs. incremental revenue from S&S
- Cohort retention after any stockout or delay events
Translate each KPI into measurable thresholds:
- Row-count deltas day over day by SKU and marketplace (alert if beyond expected seasonality)
- Freshness SLA by source (for example, Orders API within 2 hours of last event)
- Null-rate on key fields (discountpercent, issubscriber_order)
- Mismatch index: subscriber count by SKU from old vs. new, within a tolerance band you set
First-hand example (scenario): A beauty brand rebuilt its subscriber dashboards by combining Orders API data with inventory positions and internal discount rules. They didn’t find a single new report that just worked, so they defined a canonical subscription fact table and re-derived cadence metrics. Result: cleaner logic and faster refreshes than the legacy report.
Modeling blueprint
- Fact table: subscription_fact at order item per cycle grain
- Dimensions: productdim (ASIN or SKU attributes), timedim, marketplacedim, discountdim
- Events: subscriptionevent (created, skipped, frequencychanged, cancelled)
- Snapshots: subscriptionstatusscd for current vs. historical state
Pro tip: enforce data contracts at the model boundary. If a source stops sending discount_type or changes a field name, the contract fails loudly and early, not after a CFO asks why margin fell off a cliff.
Migrate like an engineer
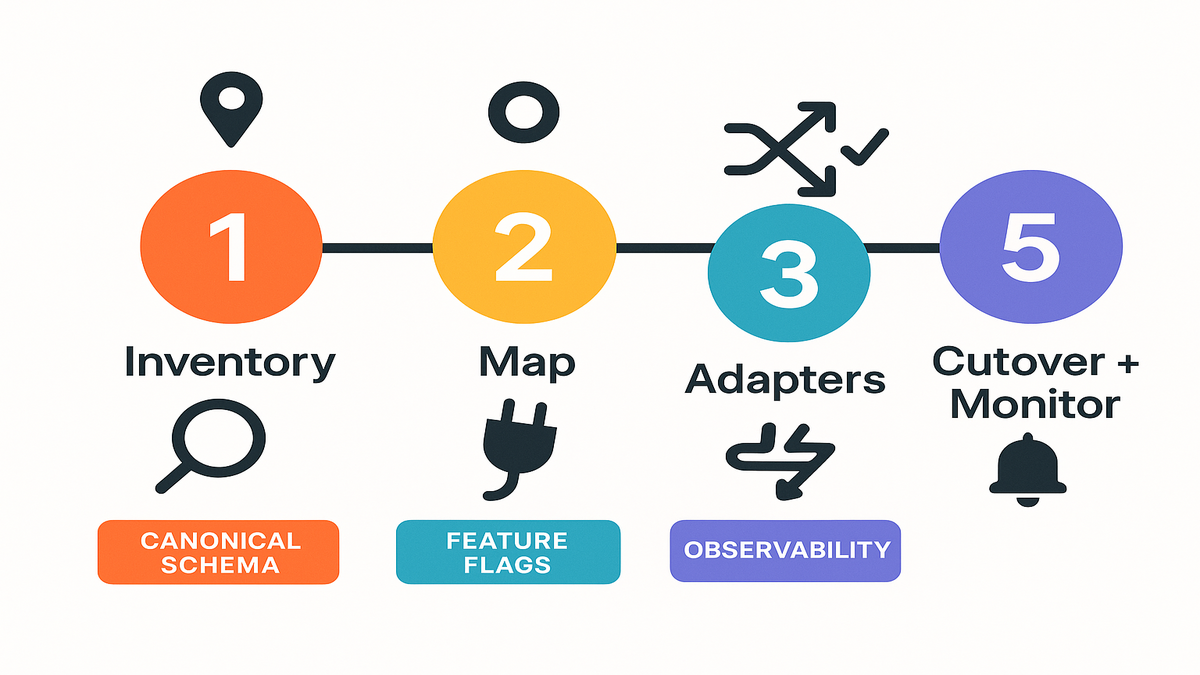
Step 1 Inventory dependencies
- Search your codebase and pipelines for references to deprecated FBA Subscribe and Save report type values.
- Document where those outputs feed: forecasting, pricing, merchandising, replenishment.
Add a quick impact map: which dashboards, which SLAs, and which execs care. This helps you prioritize SKUs and marketplaces during the dual-run so you don’t boil the ocean.
Step 2 Map to SP API
- Use Reports API (v2021-06-30) for exports still supported by Amazon.
- For subscriber behavior, stitch from Orders API and internal records as needed.
- Design a canonical data model: define fields for cadence, discount, churn, and fulfillment status.
In practice, most teams rely on Orders API for order-level truth and enrich with internal rules to tag subscriber orders and discounts. Keep the mapping explicit: how do you detect a subscriber order? What event implies a skip? Which field is the source of truth for discount_amount? Write it down, then encode it.
Step 3 Build adapters
- Create a translation layer that standardizes inputs from multiple sources into your canonical subscription dataset.
- Avoid hardcoding report type values; use named constants and feature flags.
Think of adapters as plug-and-play connectors. Today it might be Orders API plus a warehouse table. Tomorrow you might add a supported Reports API export. Your downstream models shouldn’t care which upstream is speaking, as long as the contract is met.
Step 4 Dual run validate
- Run old vs. new pipelines in parallel for 1–2 cycles.
- Reconcile at the metric level (for example, subscriber count by SKU matches within tolerance).
Start with top-line reconciliation (total subscriber orders, total subsidy) and then go SKU by SKU for your top 20% revenue drivers. Keep a living discrepancy log with root cause and fix. Expect some misalignments: timing windows, cancelled-but-not-shipped logic, and partial fulfillments explain most gaps.
Step 5 Cut over
- Add monitors for data freshness, volume anomalies, and schema drift.
- Roll back only at the adapter layer, not the whole pipeline.
Use a feature flag to flip consumers from legacy to new. Put the flag in config, not code, so you can switch in minutes. Freeze non-essential deployments for 24–48 hours after cutover to reduce noise.
Bonus step: Backfill your history. If legacy outputs stopped on the removal date, you’ll want to rebuild at least 60–90 days of subscription facts from the new logic so seasonality comparisons remain valid.
First-hand example (scenario): An electronics seller built a small subscription adapter microservice to convert Orders API records and discounts into a standardized table. During dual-run, they flagged a 4% mismatch in subscriber counts—root cause: cancelled-but-unshipped orders were counted as active. They patched the logic and cut over cleanly.
Common pitfalls to avoid:
- Timezone drift between API timestamps and warehouse load timestamps
- Partial shipments counted as full fills
- Throttling surprises during backfills (batch your calls and respect rate limits)
- Mixing marketplace currencies without normalization
- Recomputing discounts after promotions expire, which changes historical facts
Borrow this from Salesforce
Why Salesforce discipline helps
If you’ve managed report types in Salesforce, you know the drill: define relationships, control fields, and reduce breakage. The same governance mindset saves you when Amazon sunsets a report type.
Best practices you can steal
- Use a custom report type mindset: In Salesforce, you build CRTs to control joins and fields. Do the same in your warehouse: define a canonical subscription schema and force all dashboards through it.
- Don’t hardcode: In Salesforce, you can’t change a saved report’s type; you usually Save As into a new type. Treat API report sources similarly—swap adapters, not every downstream query.
- Field hygiene: Salesforce won’t let you remove fields from standard report types; you curate with custom report types. Mirror that: don’t expose raw API fields to business users; expose curated models.
Map this thinking to your BI layer: in Looker, expose a single Explore for subscriptions; in Power BI, publish a certified dataset; in Tableau, use a governed data source. Hide the messy upstream. Keep the consumption layer stable even as you iterate upstream connectors.
Quick answers to Salesforce questions
- Report type removals in Salesforce? It’s rare for Salesforce to remove standard report types, but fields can vanish if objects or permissions change. Translation: your BI should be resilient to source drift.
- Change report type of existing report? Historically, Salesforce doesn’t allow changing a saved report’s type directly. The workaround is to rebuild or Save As with a different type. Apply the same principle to your SP-API migration: rebuild against the new model rather than patching every query.
- Remove fields from standard report type? You can’t directly remove them; use a Custom Report Type to curate. For SP-API, curate via your semantic layer.
First-hand example (scenario): A RevOps team standardized all subscription analytics on a single Subscription Fact model (akin to a Salesforce custom report type). When Amazon removed the deprecated reports, they only swapped the upstream adapter—every dashboard stayed intact.
Future proof your stack
Build a deprecation ready architecture
- Schema registry and contracts: Version your subscription schema and validate incoming feeds.
- Feature flags: Toggle data sources without redeploying every consumer.
- Canary checks: Sample new source outputs against known-good metrics before full cutover.
- Observability: Track freshness, completeness, and distribution changes in your pipelines.
Instrument the whole path: source pulls, staging tables, transforms, and published models. A simple trio of monitors—freshness, volume, and null-rate—catches most breakages fast. Keep alert thresholds sane so you get signal, not noise.
If you’d rather not build these monitors from scratch, Requery provides automated freshness, schema-drift, and anomaly checks tailored for Amazon data pipelines.
Process that keeps you safe
- Deprecation watchlist: Maintain a single doc tracking vendor deprecations (Amazon, Salesforce, payments, ads APIs).
- Quarterly game days: Rehearse a mock deprecation and time your recovery.
- Dual-run policy: Always overlap feeds for at least one full business cycle.
Add a lightweight RACI: who owns detection, decision to cut over, communications, and rollback. Create a comms template for leadership and CX so everyone knows what to say if customers ask about delays or discounts.
Security and compliance quick hits:
- Rotate keys and least-privilege for SP-API roles
- Mask PII in non-prod
- Log and retain API errors for forensic analysis (with sensitive fields redacted)
Performance and cost:
- Batch API calls to respect rate limits and avoid retries
- Compress and partition warehouse tables for fast rebuilds
- Cache stable lookups (catalog, mappings) to cut API spend and speed jobs
Fast pulse check
- Amazon removed deprecated FBA Subscribe and Save report types on Dec 11, 2025.
- If you relied on them, you’ll feel it in forecasting, discount logic, and churn.
- Map to current SP-API surfaces, define a canonical model, and dual-run.
- Use Salesforce-like governance: curated models, no hardcoding, controlled fields.
- Add observability and a deprecation playbook to make the next change boring.
FAQs sellers and devs
Which FBA Subscribe Save values
Amazon removed deprecated report type values tied to Subscribe and Save as of December 11, 2025. If your requests referenced those values, they no longer return data. Check the Reports API documentation and your code references to identify impacted calls.
Practical next steps:
- Grep your repos for old report type strings
- Check your job scheduler for recent failures or abnormal runtimes
- Validate whether impacted jobs attempted retries or quietly marked success with empty payloads
Single replacement report
Not necessarily. In many cases, you’ll rebuild S&S visibility by combining supported Reports API exports, Orders API data, and your internal warehouse modeling. The safer approach is to model a canonical subscription dataset and plug multiple sources into it.
Design for multiple inputs from day one. If you find a helpful export, great—treat it as one adapter. If it goes away later, your model stays intact and your dashboards don’t care which source was speaking yesterday.
Know if integration broken
Look for error responses from the Reports API, zero-row results where data used to exist, or downstream symptoms (missing forecast snapshots, empty dashboards, failed jobs). Add monitors for data freshness and row counts at the pipeline level.
Also check for subtle clues: sudden drops in discountamount, a spike in nulls for issubscriberorder, or a flatline in subscriptionevent activity. If your warehouse has job lineage, scan for upstream tasks that stopped producing.
Change Salesforce report type
Typically, no. Salesforce generally doesn’t let you switch the report type on a saved report. The common approach is to rebuild or use Save As with the desired report type and reapply filters and columns. Take the same mindset with SP-API: switch at the adapter or model layer, not in every downstream asset.
Treat this as a forcing function to clean up legacy reports and rebuild them on a curated dataset. You’ll usually delete more cruft than you recreate.
Remove fields from standard report
You can’t directly remove fields from a standard report type. Create a Custom Report Type (or use Enhanced Report Types) to curate which fields are exposed. For your data stack, use a semantic layer to expose only vetted fields.
That curation prevents report sprawl and fragile joins. Business users get a single, trustworthy lens instead of a buffet of half-baked fields.
Fastest way to cut over
Dual-run. Keep the legacy output (if still available in your environment) in parallel with the new pipeline for at least one business cycle. Reconcile metrics, set thresholds, then cut over with monitors and an instant rollback plan.
If you can, pick a quiet window—overnight or weekend—for the flip. Announce a freeze on non-critical changes for 24–48 hours so you can isolate issues fast.
Two week sprint plan
- Day 1–2: Inventory code, jobs, and dashboards using the deprecated report types.
- Day 3: Define your canonical subscription schema (fields, grain, joins).
- Day 4–6: Map to current SP-API sources; build an adapter that outputs your schema.
- Day 7–8: Dual-run legacy vs. new; reconcile key metrics (subscriber count, discounts).
- Day 9: Patch logic gaps; rerun comparisons.
- Day 10: Enable monitors for freshness, volume, and schema.
- Day 11–12: Cut over during a low-volume window; keep feature flag ready.
- Day 13–14: Watch dashboards, ticket queue, and alerts; finalize rollback notes.
Add depth to each day:
- Day 1–2: Build an impact matrix (system → table → dashboard → owner → SLA). Prioritize high-revenue SKUs and marketplaces.
- Day 3: Lock the schema in a versioned spec (JSON Schema or similar). Write sample payloads and acceptance tests.
- Day 4–6: Implement the adapter with idempotent loads and retry-safe API calls. Cache lookups (product, discounts) to reduce API chatter.
- Day 7–8: Reconcile top-line first, then SKU-level for top 20% revenue. Log every mismatch with suspected cause and fix.
- Day 9: Patch edge cases (cancelled-but-unshipped, partials, timezone). Re-run reconciliations until within your tolerance band.
- Day 10: Wire alerts to Slack or Email with clear runbooks. Alert on both freshness and anomalies.
- Day 11–12: Flip the feature flag. Keep logs verbose for 48 hours. Freeze non-critical deploys.
- Day 13–14: Close the loop. Document lessons learned, delete dead jobs, and backfill history to keep trending intact.
In the end, this isn’t just about surviving a report removal. It’s about maturing your data contracts so vendor changes stop whiplashing your ops. Build a canonical model for subscriptions, feed it from multiple sources, and run dual until your metrics agree. Ironically, losing a report can make your reporting better—if you take the opportunity to design it right.
Want to see how teams executed similar cutovers without churn or stockouts? Browse our Case Studies.
When your data layer is modular, deprecations become routine maintenance—not a 2 a.m. incident. That’s the real win.