

You’ve been watching sales without traffic context. Like checking the scoreboard with the lights off.
Good news: Amazon just flipped the switch for vendors. On Dec 3, 2025, the Selling Partner API changelog confirmed traffic now shows up in Data Kiosk’s sourcingView. Translation: you can finally tie page views and glance views to products you supply via POs.
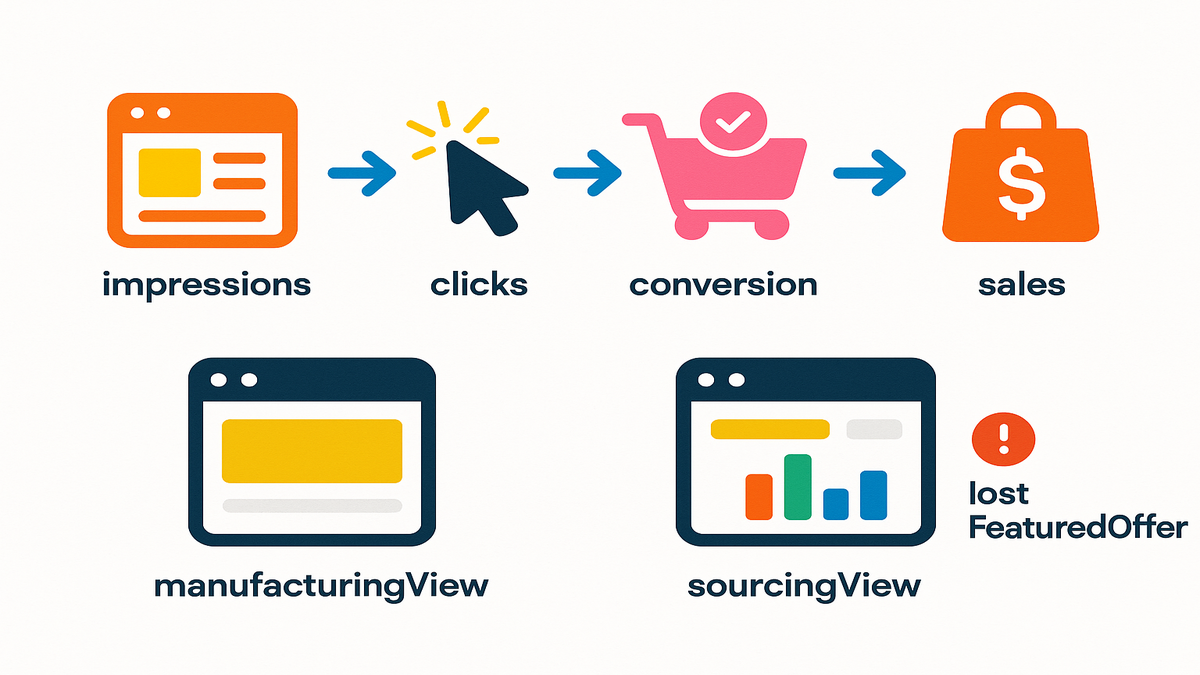
Also notable: Amazon added lostFeaturedOffer to the Traffic data set. Now you can see when you weren’t in the Featured Offer (aka Buy Box) and how that links to traffic and sales. More signal. Less guessing.
If you’ve been exporting manufacturingView for context but running ops from sourcingView, this fix closes a giant gap. You can put sales and traffic on one canvas, by vendor code, aggregated by day, week, month, or quarter. That means better demand planning, smarter promo calls, and fewer painful “why did sales dip?” post‑mortems.
Here’s what that means in plain English: the dataset that powers PO‑based decisions finally includes the visibility your team was missing. Instead of guessing if a dip was demand, a Buy Box issue, or a content problem, you can see the funnel from glance view to conversion to units in one place.
If you’re a vendor leader, this is a permission slip to align retail, ads, and ops around the same KPIs. And if you’re the data person, it’s your cue to standardize definitions, document joins, and ship dashboards that explain the “why,” not just the “what.”
—
Key Takeaways
- Traffic data is now available in Data Kiosk’s sourcingView via SP‑API—no more zeros or nulls.
- You can tie glance views, page views, CTR, and lostFeaturedOffer to the products you actually source.
- Use traffic + sales to improve forecasting, promo timing, pricing tests, and retail readiness.
- Sourcing vs. manufacturing views serve different questions—use both, but don’t mix them up.
- Start with light QA: confirm joins (ASIN/SKU), date granularity, and marketplace scope before rolling dashboards.
- Track Featured Offer stability alongside ads; media without the box burns budget.
- Version your metric definitions (glance views, CTR, conversion rate proxy) so teams stop arguing and start fixing.
- Pilot in one marketplace, then scale—don’t refactor mid‑rollout.
What Changed And Why
The fix in one line
"Traffic data is now included and correctly reported in the sourcingView queries of the Data Kiosk Vendor Analytics dataset." — Amazon SP‑API Changelog (Dec 3, 2025)
Before this, you’d request traffic in sourcingView and get nothing useful—zeros, nulls, or half‑filled fields. That broke the basic ecommerce loop: impressions → engagement → conversion → sales. Now you can run that loop for the inventory you actually supply to Amazon, aggregated by date. You’ll see how many shoppers looked, clicked, and converted—tied directly to your PO‑sourced catalog.
This unlocks a clear operational story. When glance views rise, you know demand is there. If conversion sags while traffic climbs, check Buy Box status, delivery promise, price, and PDP content. If both traffic and conversion fall, you’re likely seeing external demand shifts. It’s the difference between steering by vibes and steering by instruments.
Why vendors felt blind
- Planning without traffic is guesswork. Sales can be flat because demand fell or because you lost the Featured Offer. Without traffic metrics (glance views, page views), you can’t tell.
- ManufacturingView ≠ SourcingView. ManufacturingView shows your brand footprint regardless of supplier. SourcingView focuses on your supplied products by vendor code. If your ops are PO‑based (they are), sourcingView is the control room.
- Marketing and retail teams were de‑synced. Media drives traffic; retail wins the conversion. Missing traffic made attribution look broken and made Ops overcorrect on price or inventory.
- Seasonality was easy to misread. A dip looked like “Q4 softness” when it was a week‑long Buy Box loss.
- 3P competition masked issues. ManufacturingView might look fine while your own supply underperformed in sourcingView.
If you need to quantify media’s contribution and tie exposures to on‑site traffic and conversion, consider AMC Cloud to build audience and attribution analyses that align with your new sourcingView visibility.
The new upside
- Tie promos to traffic surges in real time. If a price drop spikes glance views but conversion flatlines, check lostFeaturedOffer or detail page quality.
- Build conversion ladders by category and seasonality. When traffic is healthy but conversion lags, you know where to focus.
- Align marketing with Ops. Traffic patterns inform replenishment, PDP fixes, and PDP content testing.
- Validate retail media. Map paid search or DSP bursts to next‑day glance views and downstream sales movement.
- Benchmark elasticities. See where a 5% price change moves traffic versus conversion, then codify rules by category.
This is the data completeness vendors were asking for. Now it’s on you to turn it into a process.
Sourcing vs Manufacturing
Quick definitions you’ll actually use
- SourcingView: Metrics tied to products you directly supply to Amazon (PO‑based), aggregated by date. This is your operational truth for inventory, price, promo, and ship plans.
- ManufacturingView: Metrics tied to products your brand manufactures, regardless of supplier. Great for brand‑wide footprint analysis and competitive context, but not a proxy for your PO performance.
Think of ManufacturingView as your brand’s aerial map and SourcingView as your cockpit. The aerial map shows the whole landscape; the cockpit gives you the instruments you can actually control.
When to pick which
- Use sourcingView when you care about: vendor code, PO‑driven revenue, inbound planning, cost‑of‑goods impacts, lostFeaturedOffer effects, and store readiness.
- Use manufacturingView when you care about: brand halo, category benchmarking, third‑party activity, and where your brand is winning/losing across supply paths.
A simple rule: if the action ends with a PO, price change, or content update you own, start in sourcingView.
Why this separation matters
Mixing them muddies questions like “Did our price drop work?” In manufacturingView, conversion changes might reflect another supplier’s inventory or pricing. In sourcingView, you’re isolating your supply.
It also keeps teams honest: brand leads can chase category share in ManufacturingView without disrupting replenishment math driven by SourcingView.
The new combo move
- Top‑down: Scan manufacturingView to see brand‑level demand and gaps.
- Bottom‑up: Execute in sourcingView with traffic + sales + lostFeaturedOffer to validate if your changes (price, content, promo) moved the needle.
As W. Edwards Deming put it, “If you can’t measure it, you can’t improve it.” You now have the missing measurements in the view that runs your business.
Getting The Data
What you can pull
- Traffic: glanceViews, pageViews, clickThroughRate, add‑to‑cart rate (when available), lostFeaturedOffer.
- Sales: unitsOrdered, orderedRevenue, conversion rate proxies.
- Dimensions: date, marketplace, ASIN, SKU, and vendor code.
- Aggregations: day, week, month, quarter.
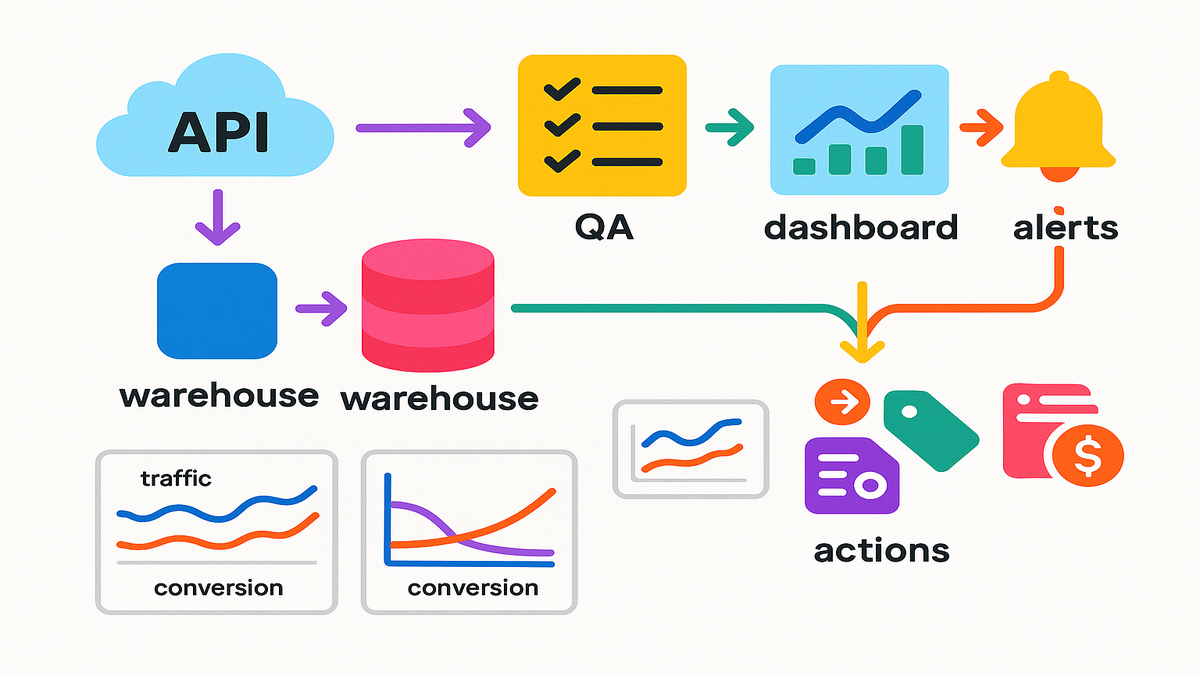
If you’re centralizing this in a warehouse, keep raw fields intact and compute derived metrics (e.g., conversion proxy = unitsOrdered/glanceViews) in a modeled layer so you can tweak definitions later.
A practical flow
Note: Field names vary by API version; treat this as a pattern, not exact code.
- Query sourcingView by date range and marketplace.
- Request traffic + sales blocks together.
- Join outputs on ASIN/SKU + date in your warehouse.
- Add “lostFeaturedOffer” to your monitoring—spikes often explain conversion dips.
Example shape:
- Inputs: startDate, endDate, marketplace, aggregateBy.
- Outputs: [asin, sku, date, traffic.glanceViews, traffic.pageViews, traffic.clickThroughRate, traffic.lostFeaturedOffer, sales.unitsOrdered, sales.orderedRevenue].
Implementation tips:
- Batch by marketplace and date to manage pagination and retries.
- Store a watermark (last successful date) and re‑pull T‑1 and T‑2 for late posts.
- Keep idempotent loads: upsert on [asin, sku, date, marketplace].
Sanity checks before trust
- Time windows: Confirm timezone and posting delays; many vendor datasets post on a T+1 or T+2 cadence.
- Dupes and joins: Standardize ASIN/SKU casing; confirm one row per ASIN/SKU/day.
- Marketplace scope: Don’t blend US/CA/UK by accident.
- Outliers: A sudden jump to 0 traffic rarely happens organically—flag and re‑pull.
- Definitions: Align on whether “conversion rate” uses glanceViews or pageViews as the denominator.
- Coverage: Spot‑check a handful of ASINs in Vendor Central or your BI to ensure non‑zero traffic lines up with known promos.
A small real world example
A mid‑market CPG vendor saw flat sales in October. With the new sourcingView traffic, they found glance views rose 18% while lostFeaturedOffer spiked for a week—pricing fell below the floor at a competing seller, knocking them out of the Featured Offer. Fix price, win back the box, conversion normalized. Without traffic + lostFeaturedOffer in sourcingView, they would’ve misdiagnosed it as a demand issue.
Another: a seasonal home brand expected lower November traffic. Instead, glance views were flat, but CTR slid after a content refresh. They reverted hero images and restored bullet order. CTR rebounded, units followed. The lesson: traffic volume wasn’t the problem—merchandising was.
Turn Metrics Into Money
Demand planning that doesn’t overreact
- If traffic up, conversion flat: investigate Featured Offer, delivery promise, and PDP content. Don’t auto‑order more inventory—fix the funnel.
- If traffic down, conversion stable: you might be under‑marketed or buried in search. Shift spend or test price.
- If both down: external demand likely cooled; trim POs and preserve working capital.
Add nuance:
- Break out new vs. existing ASINs; new items often have low review counts and lagging conversion even with healthy traffic.
- Watch lead times; pair “traffic up” with “weeks cover” so you don’t stock out while fixing conversion.
Marketing that proves its keep
- Tie paid search bursts to glance views in sourcingView by day/week. No lift? Shift terms or creative.
- Use clickThroughRate as a proxy for on‑site appeal; if CTR improves but conversion doesn’t, fix readiness (images, bullets, A+ Content, reviews).
- Layer lostFeaturedOffer as a guardrail. No Featured Offer = ads waste.
Quick experiment:
- Run a 7‑day keyword test; log daily glance views and conversion. If traffic rises but conversion dips, pause spend, fix PDP, then restart. Document the delta.
Pricing and promo with spine
- Track price tests alongside glance views and conversion. Look for elasticity sweet spots by category.
- If a promo spikes traffic but tanks margin, check if you lost the box to a reseller during the promo window; that’s fixable.
- Use post‑promo readouts: did traffic revert or hold a portion of the lift? Codify re‑promo cadences accordingly.
Retail readiness as system
Use traffic‑to‑conversion ladders to prioritize PDP fixes.
Monitor add‑to‑cart rate (when available) and returns to catch misaligned expectations.
Keep a playbook: image swaps, title tweaks, bullets, A+ blocks, Q&A hygiene—one change at a time so you can attribute impact.
This is a traffic data Data Kiosk Vendor Analytics review you can act on—not another dashboard you admire.
Halfway Hit List
- Use sourcingView for PO‑based truth; manufacturingView for brand context.
- Pull traffic + sales together and QA joins, timezones, and marketplaces.
- Monitor lostFeaturedOffer alongside traffic to explain conversion swings.
- Convert findings into process: forecasting, promo timing, pricing, and PDP fixes.
If your team only does the four bullets above for 30 days, you’ll catch 80% of avoidable revenue leaks.
How To Implement
Keep it modular
- Create a new dataset for sourcingView traffic; don’t overwrite historical manufacturingView logic.
- Version your metrics dictionary: define glanceViews, pageViews, CTR, and lostFeaturedOffer explicitly.
- Keep derivations (e.g., conversion proxy) in a modeled layer, not raw.
Warehousing and BI
- Warehouse: Land raw, stage with standardized keys (asin, sku, marketplace, date), then model.
- BI: Build a single daily panel with [date, ASIN/SKU, marketplace, traffic metrics, sales metrics, lostFeaturedOffer].
- Alerts: Threshold‑based alerts for “traffic up, conversion down” and “lostFeaturedOffer spike.”
Need resilient SP‑API ingestion with retries, pagination management, and schema‑drift guardrails? Check out Requery.
Governance and access
- Permissions: Limit write access; keep a data steward for SP‑API schemas.
- Documentation: Add a one‑pager in your wiki: what changed, when, and how to use it.
- Change control: Announce metric definition updates and keep a changelog.
- Privacy: While these datasets avoid PII, enforce least privilege and audit access.
Rollout checklist
- Pilot with one category and one marketplace for two weeks.
- Compare old decisions vs. new decisions enabled by traffic data.
- Lock the definitions; then scale to all marketplaces.
- Backfill 60–90 days once you trust QA so you can run pre/post analyses.
If you’re wondering “traffic data data kiosk vendor analytics example,” this rollout is the blueprint.
FAQs Vendors This Week
traffic fix for sourcingView
Yes, the correction specifically addressed missing traffic in sourcingView. ManufacturingView already supported traffic. With the fix, sourcingView traffic is now available and correctly reported. Always confirm in your environment since access and entitlements can vary.
What’s the deal with lostFeaturedOffer
Amazon added lostFeaturedOffer to the Traffic data, which lets you see when your product wasn’t in the Featured Offer. Correlate spikes in lostFeaturedOffer with dips in conversion to diagnose pricing or availability issues fast.
Does this use GraphQL
Data Kiosk supports flexible, GraphQL‑style querying so you can request only the metrics you need. Field names and schemas can evolve, so check the official SP‑API docs and examples before you code your integration.
How soon will data post
Posting cadences can vary by dataset and marketplace (often T+1 to T+2). Validate in your account: pull the last three days daily and track completion times to inform your ETL schedule and alerting.
Blend sourcingView and manufacturingView
Yes—but label it clearly. They answer different questions. Keep a clean dimension for “view_type” and avoid mixing them in the same KPI unless you’re explicitly showing the difference.
Where can find example queries
Check the official SP‑API documentation and the Amazon SP‑API GitHub repo for patterns. Many teams share examples and best practices in those channels, including field lists and pagination tips.
Are glance views sessions
Treat glance views as detail page views; sessions are broader site visits. Use glance views for product‑level funnel math and consult SP‑API documentation for exact definitions in your dataset version.
Need to reprocess history
Re‑pulling recent history (e.g., last 60 days) after the fix is smart to fill prior gaps. Keep original extracts in a cold layer so you can compare and validate changes.
Any rate limits to watch
SP‑API enforces rate limits. Batch requests, implement exponential backoff, and cache stable dimensions. The official docs outline limits by endpoint—design for retries and idempotency.
First SourcingView Traffic Pull
- Confirm SP‑API access and Data Kiosk entitlements for sourcingView.
- Define scope: marketplace(s), date range, and aggregation (day/week/month).
- Request traffic + sales + lostFeaturedOffer together for the same dimensions.
- Land raw data, standardize keys (asin, sku, marketplace, date), and de‑duplicate.
- Create a daily panel: traffic → conversion → sales with clear field definitions.
- QA with a spot‑check: 10 ASINs across three days; verify non‑zero traffic.
- Build two visuals: (1) Traffic vs. conversion over time, (2) lostFeaturedOffer vs. conversion.
Two nice‑to‑haves: auto‑flag “traffic up, conversion down” and annotate charts with price changes, promos, and media bursts. Your readouts will go from descriptive to diagnostic.
You’ve got the missing puzzle piece back in the box. Use it. Run your next promo only if Featured Offer stability looks solid. Let traffic trends drive your PO timing, not hunches. And when sales dip, you’ll know whether it’s a demand issue, a box issue, or a page issue in minutes—not after a quarter‑end review.